The strength of businesses is determined not by how well they do in good times, but how well they sustain through periods of uncertainty and challenges.
Looked at from this prism, we at JSW Steel have demonstrated our ability to withstand such challenges and adversities through our performance in FY 2015-16. At JSW Steel, we did not just hold on to our production levels in such a scenario. In fact, we increased our installed capacity to 18 MTPA and reported our highest ever sales in the last quarter. We were not just content with the cost savings that the commodity price softening allowed us. We went a step ahead to achieve further operational efficiencies and enrich our product mix.
The unviability of exports also did not deter us. Instead we focused on growing our domestic sales and aggressively expanding our retail network and achieve higher branded sales. Our commitment to long-term, sustainable value creation stands validated. Thus for JSW Steel, FY 2015-16 was not just a year of staying strong, but also growing stronger.
Hightlights: FY 2015-16 Standalone
₹36,202Crores
Net Turnover
₹5,723Crores
EBITDA
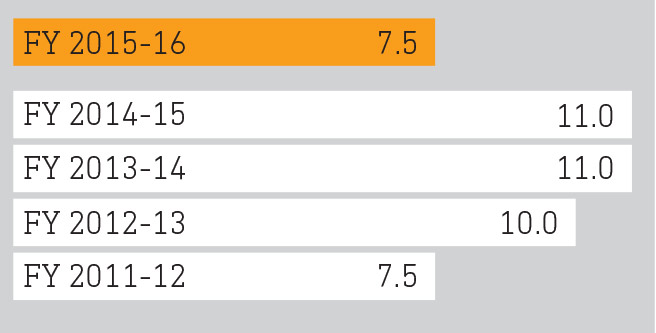
7.5%
Weighted average cost of debt as on March 31, 2016
₹7.50Per Share
Equity Dividend
JSW STEEL AT A GLANCE
JSW Steel is the flagship company of JSW Group, part of the O.P. Jindal Group. JSW Steel is among the world’s most illustrious steel companies, and is India’s leading primary integrated steel producer.
JSW Steel has plants located across six strategic locations in South and West India, namely, Karnataka, Tamil Nadu and Maharashtra. Our strategy of always staying on the leading edge of technical advancement has led to partnerships with global sector leaders; and has helped our plants rank among the world’s lowest-cost steel producers.
Key Metrics
18 MPTA
Steel - making capacity
6th
Position among worldclass global Steel makers as per WSD in 2016
Hightlights: FY 2015-16 Standalone
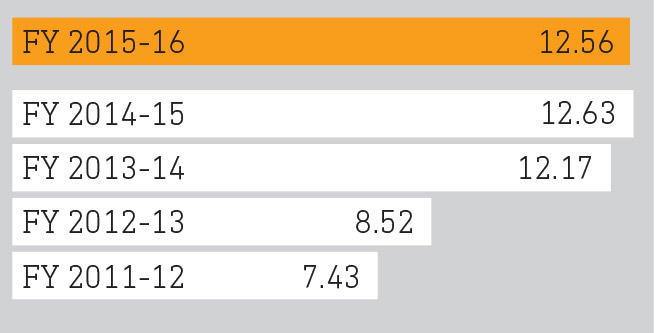
12.56 MT
Crude Steel Production
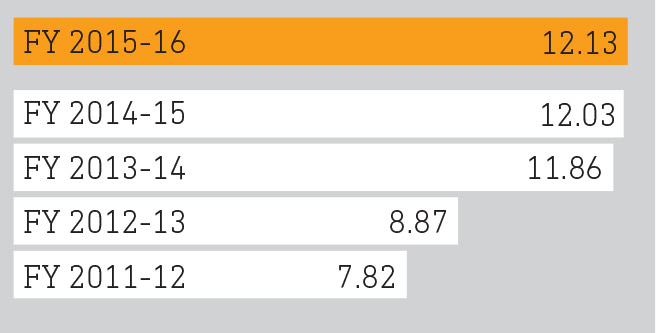
12.13 MT
Saleable Steel Sale
₹40,345Crores
Gross Turnover
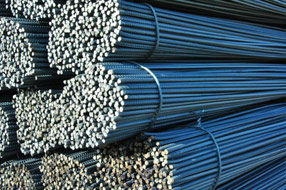
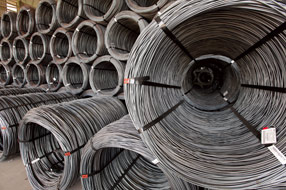
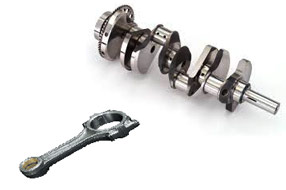
WIDE PORTFOLIO OF PRODUCTS
We offer the widest product portfolio in India and leverage our capabilities to customise offerings to fulfil specific customer needs. We are a pioneer in the use of innovative technology that keeps us ahead of competition.
-
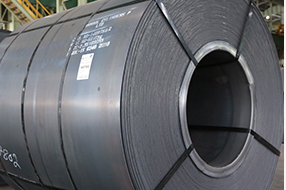
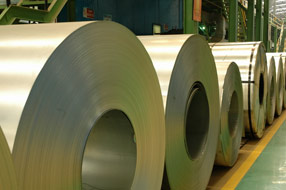
Hot Rolled
Cold Rolling & Galvanizing, Drawing & Press Forming, Electrical Stampings & Forming, Welded Tubes & Pipes
-
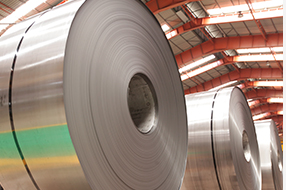
Cold Rolled
Automobile, White goods, Cold Rolled formed sections, Drums & Barrels, Furniture
-
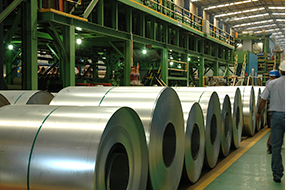
Galvanized
Roofing and Cladding, Ducting, Boxes, Coolers, Furniture, Heat Plates, Solar Heating Panels.
-
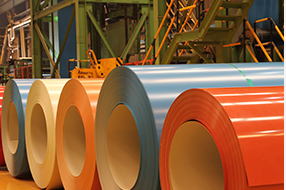
Colour Coated Products
Roofing, White goods, Appliances, Automobile bodies, Cladding etc are the main application
-
Galvalume
Roofing and Cladding, Ducting, Boxes, Coolers, Furniture, Heat Plates, Solar Heating Panels
-
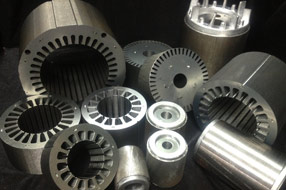
Electrical Steel
Rotating Machines, Motors, Home Appliance, Fan, Power Transformer, Reactor, Magnetic Switches
KEY PERFORMANCE INDICATORS
-
Gross Turnover
(in ₹ crores)
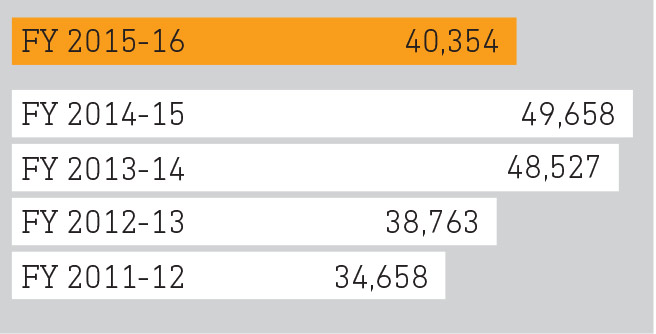
Gross Turnover declined due to decline in realisations
-
Operating EBITDA
(in ₹ crores)
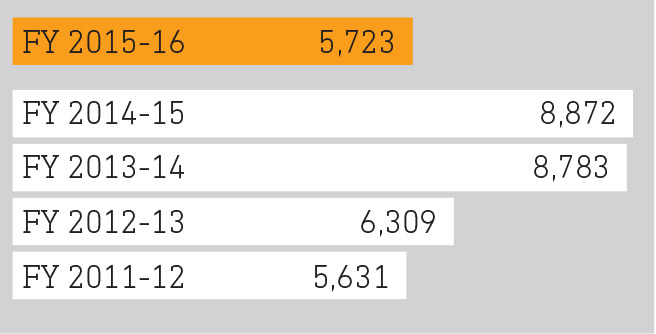
Higher production/plant utilisation and reduced cost of production contributed to a favourable EBITDA
-
Operating EBITDA Margin
(%)
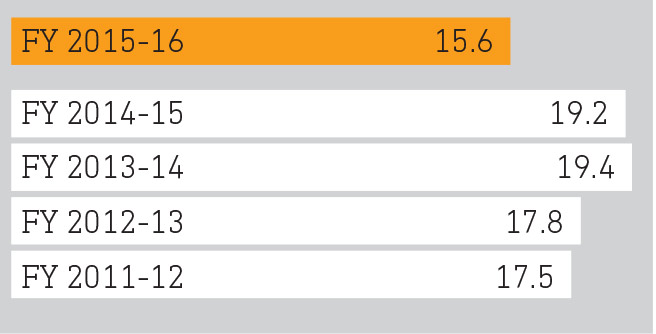
Operating Margin is lower mainly due to drop in realisations due to predatory pricing of imports
-
Profit After Tax
(in ₹ crores)
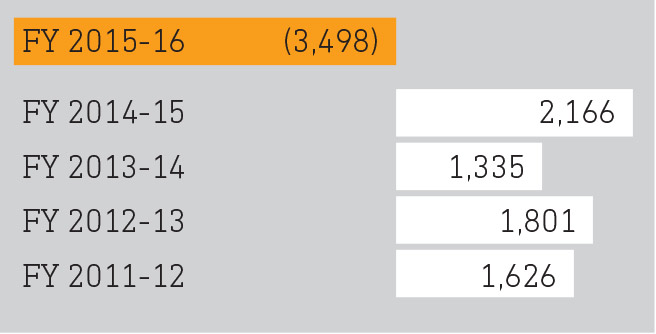
The Company posted a Net Loss due to provision for diminution in value of investments and loans and advances
-
Earnings Per Share
(in ₹)
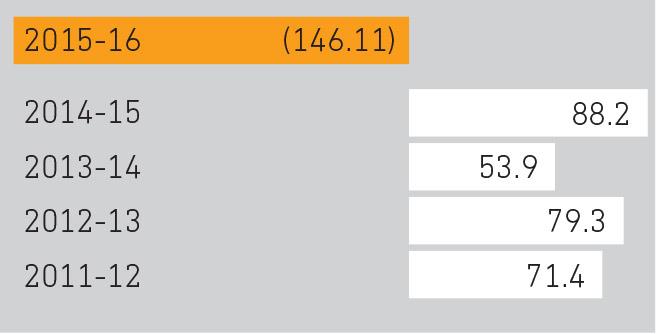
In line with profitability
-
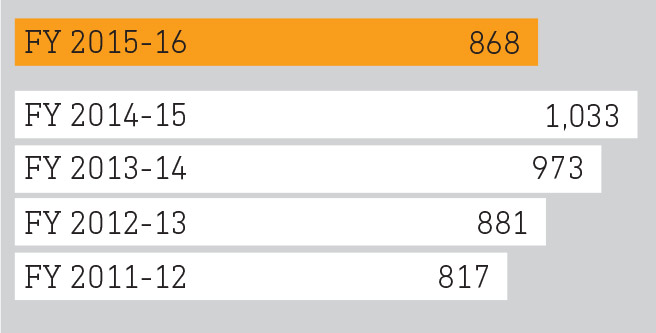
Contribution to Government & Society
(in ₹ crores)

5 years CAGR 14.3%
Gross Fixed Assets
(in ₹ crores)

Capacity expansion up to 18 million and additions of value-added steel manufacturing facilities
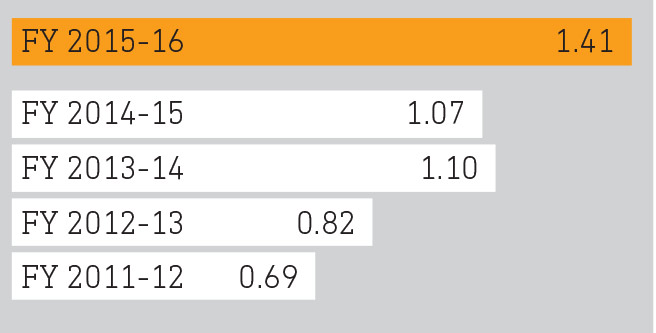
Adjusted Debt Equity Ratio
© Copyright 2016 - JSW STEEL Ltd. All Rights Reserved.