KEY PERFORMANCE INDICATORS (STANDALONE)
FY 2015-16 was particularly challenging for the steel industry with high competitive pressure, sharp decline in steel pricing and margin compression. Despite such an adverse scenario, our performance was relatively strong with improvement in sales volumes. We witnessed domestic volume growth of 20% y-o-y, driven by a focus on value added and branded products in addition to developing existing and new markets.
Profit & Loss Statement
Gross Turnover
(in ₹ crores)
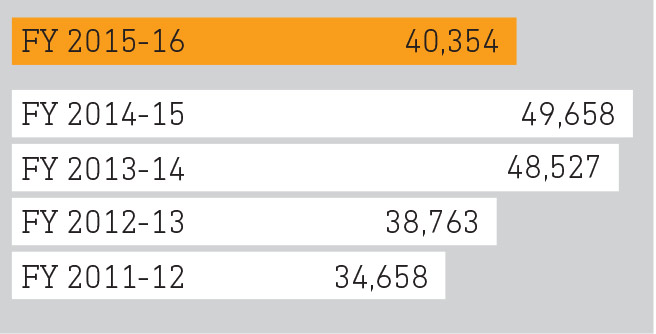
Gross Turnover declined due to decline in realisations
Operating EBITDA
(in ₹ crores)
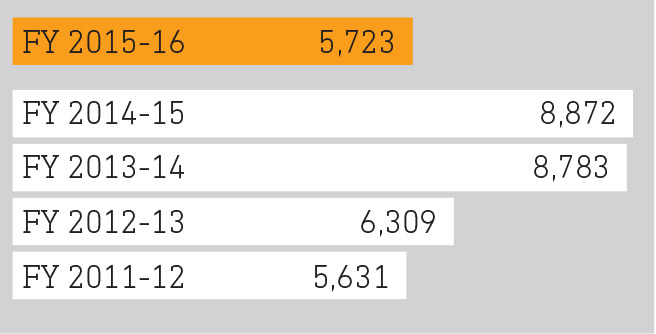
Higher production/plant utilisation and reduced cost of production contributed to a favourable EBITDA
Operating EBITDA Margin
(%)
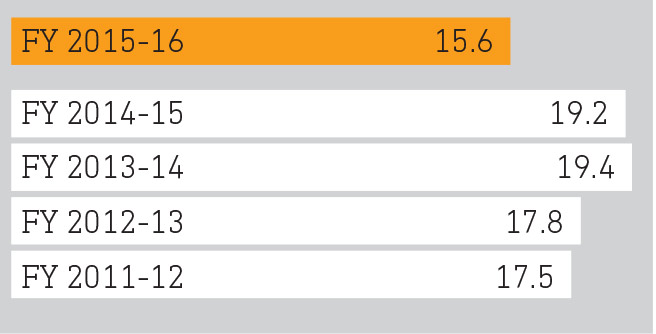
Operating Margin is lower mainly due to drop in realisations due to predatory pricing of imports
Profit After Tax
(in ₹ crores)
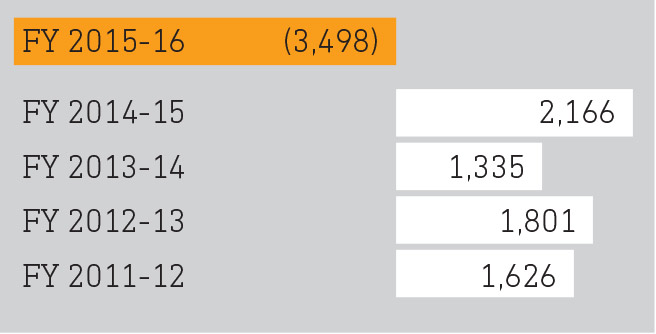
The Company posted a Net Loss due to provision for diminution in value of investments and loans and advances
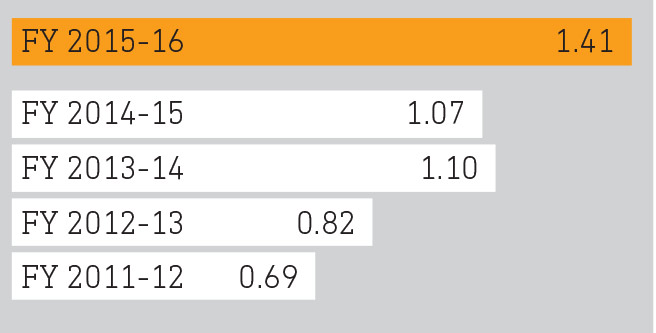
Earnings Per Share
(in ₹)
In line with profitability
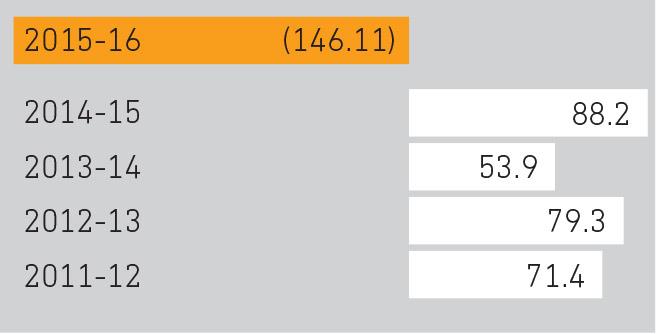
Contribution to Government & Society
(in ₹ crores)

5 years CAGR 14.3%
Balance Sheet
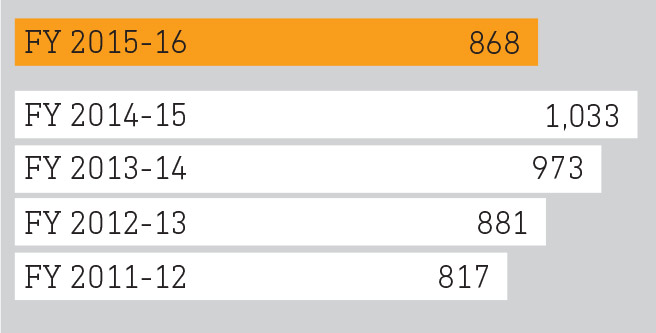
Gross Fixed Assets
(in ₹ crores)

Capacity expansion up to 18 million and additions of value-added steel manufacturing facilities
Adjusted Debt Equity Ratio
Shareholder Metrics
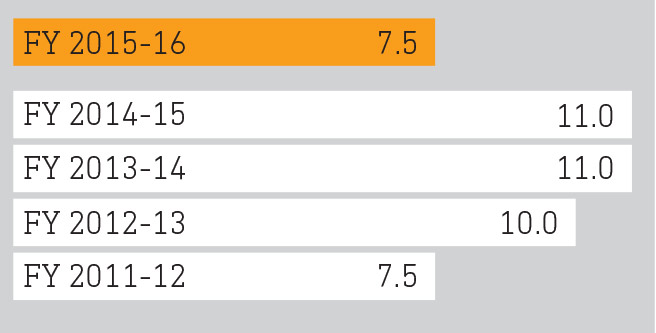
Dividend Per Share
(in ₹)
Book Value Per Share
(in ₹)
Crude Steel Production
(MT)
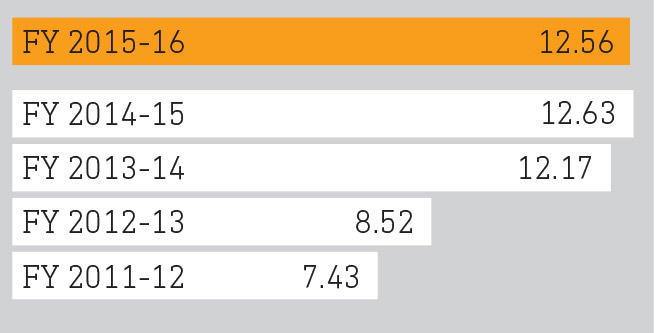
5 years CAGR 14.3%
Saleable Steel Sales
(in ₹ crores)
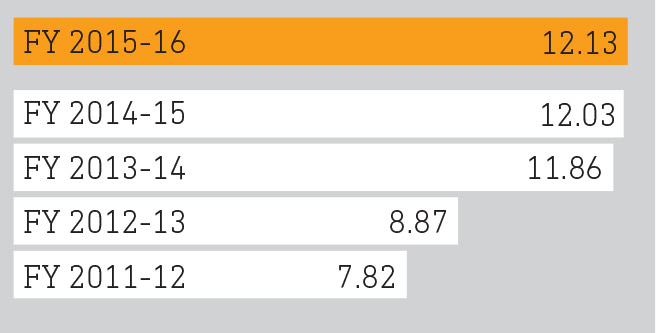
5 years CAGR 14.7%
© Copyright 2016 - JSW STEEL Ltd. All Rights Reserved.