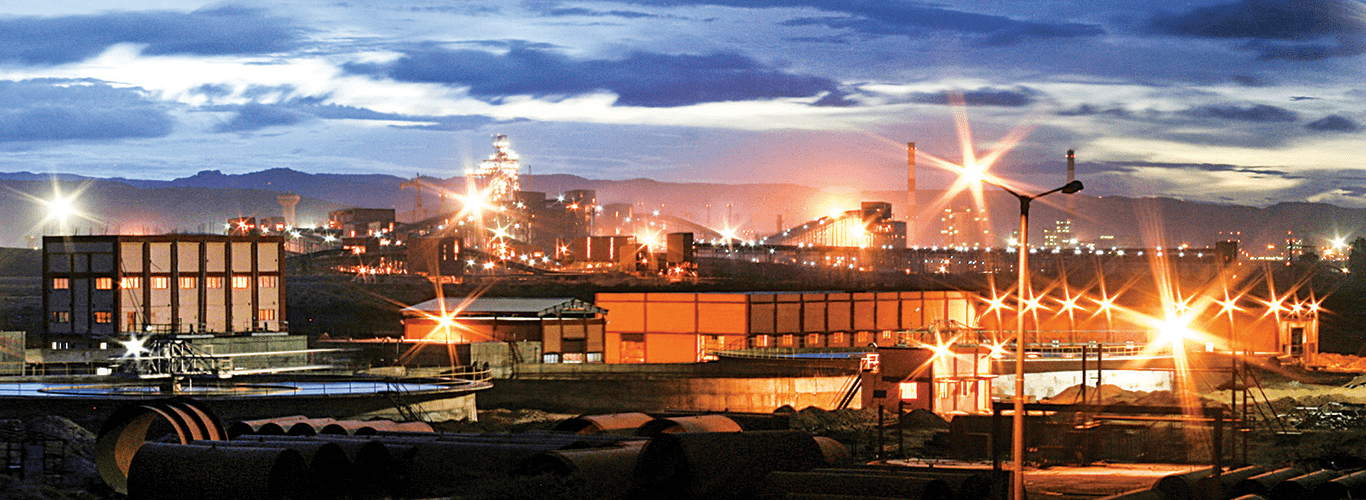
Highest Ever Annual Performance

0
MnT
Crude Steel Production
26% Y-o-Y Growth
0
MnT
Saleable Steel Sales
20% Y-o-Y Growth
`0
Crores
Revenue from Operations
32% Y-o-Y Growth
`0
Crores
Operating EBITDA
90% Y-o-Y Growth
`0
Crores
Net Profit After Tax
Negative to Positive
`0
Crores
Diluted EPS
Read More

JSW Steel at a Glance

The flagship company of the JSW Group, JSW Steel is India'-s leading steel producer with integrated, end-to-end steel manufacturing capabilities.

The company has a global presence with strong technological competencies. Poised to lead the market, JSW Steel has achieved stellar growth and has maintained its winning streak through the years. Supported by our four core values, we strive for continued distinction in the industry.
0
MnT
Installed capacity
0
Manufacturing facilities across India
0+
Countries
Export footprint
Read More

Message from the Chairman & Managing Director

Dear Shareholders,

The ‘Will to Win’ is a relentless pursuit of excellence and of doing better each day. At JSW Steel, we have built our business on this principle, which enables us to overcome any challenges or constraints that come our way, just like we did in 2016-17.

I am delighted to share with you that JSW Steel delivered strong operational performance in FY 2016-17 and recorded its highest ever production, sales, consolidated EBITDA and profit after tax.

Read More

Key Performance Indicators

Profit & Loss Statements

Gross Turnover
(in ` crores)
  • 38,763
  • 48,527
  • 49,658
  • 40,354
  • 56,244
  • FY 12-13
  • FY 13-14
  • FY 14-15
  • FY 15-16
  • FY 16-17

The Gross Turnover increased because the Company explored opportunities in the export market, while maintaining sales in the domestic market.

Operating EBITDA
(in ` crores)
  • 6,309
  • 8,783
  • 8,872
  • 6,369
  • 11,543
  • FY 12-13
  • FY 13-14
  • FY 14-15
  • FY 15-16
  • FY 16-17

Operating EBITDA increased due to multiple performance improvement initiatives taken up during the year to focus on yields and productivity.

Operating EBITDA Margin
(%)
  • 6,309
  • 8,783
  • 8,872
  • 6,369
  • 11,543
  • FY 12-13
  • FY 13-14
  • FY 14-15
  • FY 15-16
  • FY 16-17

Operating EBITDA increased due to multiple performance improvement initiatives taken up during the year to focus on yields and productivity.

Balance Sheet

Gross Fixed Assets
(in ` crores)
  • 37,607
  • 49,703
  • 53,792
  • 52,999
  • 53,293
  • FY 12-13
  • FY 13-14
  • FY 14-15
  • FY 15-16
  • FY 16-17

Gross block increased during the year primarily on account of capitalisation of the Dolvi Phase 1 Expansion and augmentation of Vijayanagar Blast Furnace 2 capacity.

Adjusted Debt Equity Ratio
(%)
  • 0.82
  • 1.10
  • 1.02
  • 1.71
  • 1.53
  • FY 12-13
  • FY 13-14
  • FY 14-15
  • FY 15-16
  • FY 16-17

Shareholder Metrics

Dividend Per Share*
(in `)
  • 10.0
  • 11.0
  • 11.0
  • 7.5
  • 22.5
  • FY 12-13
  • FY 13-14
  • FY 14-15
  • FY 15-16
  • FY 16-17

*Of `10 per share

Book Value Per Share
(in `)
  • 881
  • 973
  • 1,033
  • 844
  • 997
  • FY 12-13
  • FY 13-14
  • FY 14-15
  • FY 15-16
  • FY 16-17
Crude Steel Production
(MT)
  • 8.52
  • 12.17
  • 12.63
  • 12.56
  • 15.80
  • FY 12-13
  • FY 13-14
  • FY 14-15
  • FY 15-16
  • FY 16-17
16% 5-YEAR CAGR
Read More